DSP from Scratch · Lesson 1
What Is a Digital Signal? Sampling and Sample Rate
How a sound, a heartbeat or a video becomes a list of numbers, and how to read that list.
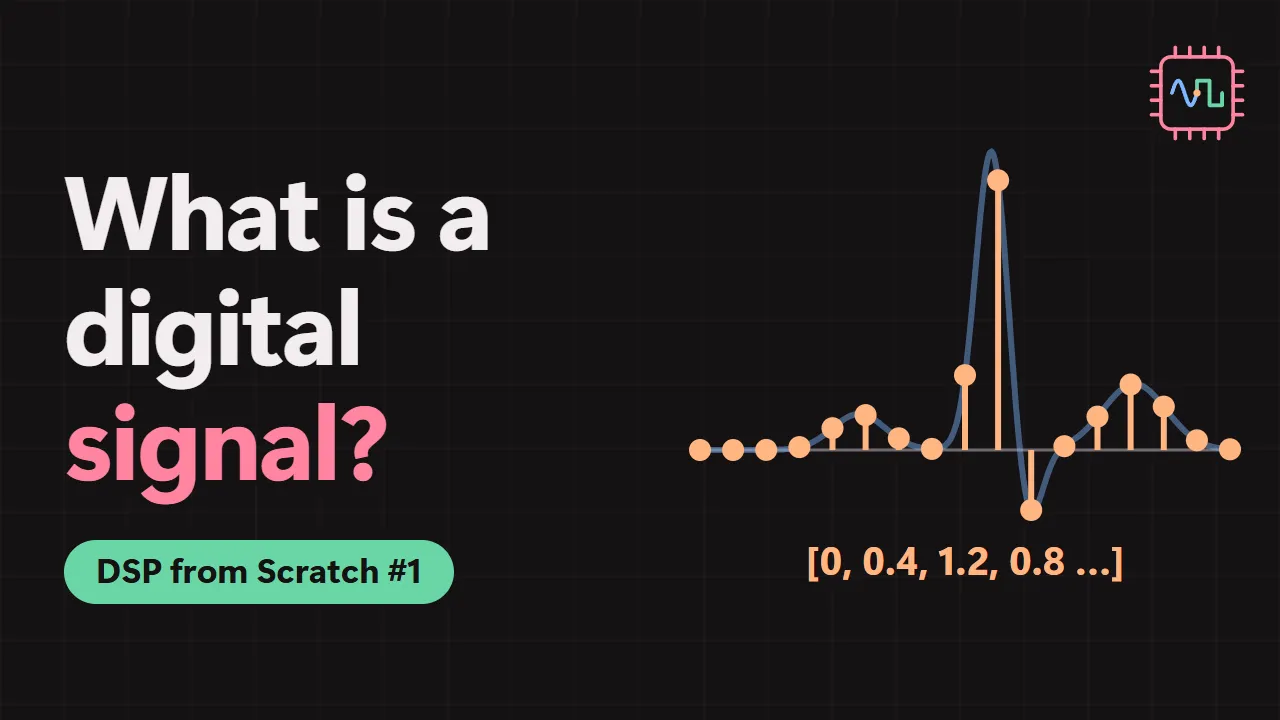
Press play: it starts at
Chapters17 parts, tap one to jump there
In one sentence
A digital signal is a list of numbers, made by writing down a measurement at regular moments.
Watch first, then read. The video shows every idea moving. These notes write out each step so you can check the maths at your own pace. Press any ▶ time button to jump the video to that moment.
Every song on your phone, every heartbeat on a hospital monitor, every video you watch: to a computer, each one is just a list of numbers. Working with those lists is called digital signal processing, or DSP. This lesson shows where the numbers come from.
All you need is school maths.
What is a signal?
A signal is any measurement that changes over time and tells us something. We draw it as a graph: time runs along the bottom, and the measured value goes up the side.
- Your body temperature through the night is a signal.
- So is the tiny voltage your heart makes with every beat.
- Sound is a signal too. When someone speaks, the air pressure near your ear rises and falls very quickly, and a microphone turns those changes into a changing voltage.
Temperature overnight
A fever shows up as a bump.
The voltage of a heartbeat
Each beat is a sharp spike.
A spoken word
A burst of fast wiggles.
The shape carries the information: a fever shows up as a bump, a heartbeat as a sharp spike, a spoken word as a burst of fast wiggles. And in nature these curves are smooth and unbroken.
The one idea: sampling
Picture a nurse who checks your temperature every hour and writes it on a chart. Your temperature existed all night, at every second. But the chart only knows the hourly readings, one numbered row for each.
A nurse who checked more often, every ten minutes, would catch a fever spike that the hourly chart missed completely.
A reading every hour
9 readings. The spike falls between two of them.
A reading every 10 minutes
49 readings. One of them lands on the spike.
Why a computer keeps only samples
Why can’t a computer simply keep the whole curve?
Because a smooth signal has a value at every instant. Between any two instants, however close together, there is always another instant in between. So a smooth curve holds endlessly many values, and a computer’s memory is finite. It can only keep a list: one value, then the next, then the next.
Engineers have a name for each:
- the smooth version is analog;
- the list of numbers is digital.
This whole course is about what we can do with those lists.
From a heartbeat to samples
Now a real signal: an ECG, short for electrocardiogram. Pads on your skin pick up the tiny voltage your heart makes with every beat. It is only about a thousandth of a volt, which we call a millivolt (mV), and it changes continuously, at every instant.
The computer keeps a list: one number, then the next. Each number is a sample.
30 readings a second
Tallest dot: 0.37 mV. Real peak: 1.2 mV.
360 readings a second
Tallest dot: 1.20 mV. Real peak: 1.2 mV.
The sample rate tells us how many numbers arrive each second. Sample faster, and the dots crowd together and follow the sharp peak better. Many ECG recordings use 360 samples a second, and so will we.
Sampled signals all around you
You meet sampled signals every day:
| Where | How often a number is written down |
|---|---|
| A phone’s voice recorder | 44,100 or 48,000 times a second |
| A well-known public collection of heart recordings (the MIT-BIH database) | 360 times a second |
| A video camera | often 30 pictures a second |
| A weather station | perhaps once a minute |
A song on your phone is, underneath, just a very long list of numbers.
x[n]: index versus value
We need a short way to write samples down. We write for sample number . The square brackets mean: look in this position in the list. We usually start counting at zero.
Take this tiny ECG list of six samples:
| index n | 0 | 1 | 2 | 3 | 4 | 5 |
|---|---|---|---|---|---|---|
| value x[n], in mV | 0 | 0.4 | 1.2 | 0.8 | 0.2 | 0 |
The index is a position in the list. The value is a voltage. Here mV: the tall peak of the heartbeat.
Two different things are in play, and it pays to keep them apart:
- the index is a position: 0, 1, 2, and so on;
- the value is what was measured there: a voltage.
Read a few straight off the list:
- mV, the first number;
- mV, the last number;
- the largest value sits at index 2, where mV.
When was each sample taken?
We write the sample rate as , with a small s for sampling. Here it is 360 samples per second. “Per second” has its own unit name, the hertz, written Hz. So
If 360 samples arrive each second, the time between two samples is one three-hundred-and-sixtieth of a second. That gap has a name, the sampling period, written . It is simply one over the sample rate:
A millisecond (ms) is a thousandth of a second.
Sample 0 is taken at the start. Each later sample comes one gap after the one before, so sample arrives after gaps:
| index n | 0 | 1 | 2 | 3 | 4 | 5 |
|---|---|---|---|---|---|---|
| value x[n], in mV | 0 | 0.4 | 1.2 | 0.8 | 0.2 | 0 |
| time n ÷ 360, in ms | 0 | 2.78 | 5.56 | 8.33 | 11.11 | 13.89 |
The same list with a third row: the time each sample was taken, at 360 Hz. Sample 2 was measured of a second in, about 5.56 ms.
Try a bigger index. Sample 100 arrives at
which is just over a quarter of a second.
And nothing in the list tells us what happened between two measurements.
How many samples does a recording hold?
We can count samples too. If samples arrive every second, then
Ten seconds of heartbeat at 360 Hz is numbers.
Video is samples too
A camera doesn’t record smooth motion. It takes a still picture many times a second, often 30, and your eyes blend the pictures into movement.
Each picture is a sample in time. Thirty pictures a second is a sample rate of 30 Hz, and the gap between pictures is
Slow-motion cameras simply take far more pictures a second, sometimes a thousand or more, so the gaps are tiny and even very fast movements are caught.
Two worked examples
Try both against the countdown in the video first, then check the working below.
How long until sample 18?
At 360 Hz, how long after sample 0 does sample 18 arrive?
Count the gaps, not the samples. There are 18 gaps between sample 0 and sample 18, and each gap lasts of a second:
A three-minute voice memo
Your phone records at 48,000 Hz. What is the gap between samples, and how many numbers are in a three-minute recording?
The gap is one over the sample rate:
A microsecond is a millionth of a second.
Three minutes is seconds, so
More than eight and a half million numbers, from just one microphone.
Choosing a sample rate
Sampling faster follows quick changes better, but every extra sample is another number to store and to process. So the right rate depends on how fast the signal moves:
- Slow signals can be sampled slowly. Outdoor temperature barely moves in a minute, so one reading a minute is plenty.
- A heartbeat’s sharp peak lasts only a few hundredths of a second, so we need hundreds of samples a second to draw it.
- Sound vibrates hundreds or thousands of times a second, so recorders take tens of thousands.
Exactly how fast is fast enough has a precise answer. It gets its own lesson: lesson 3.
Three common mistakes
Recap
- A signal is a measurement that changes over time.
- A sample is one reading of it, and a digital signal is a list of samples.
- We write for the value at index , counting from zero.
- The sample rate , in hertz, says how many samples arrive each second.
- The gap between samples is the sampling period, .
- Sample arrives seconds after the start.
- A recording holds samples.
Say the main idea aloud once: sampling means writing down a measurement at regular moments.
Next comes the sine wave, the smooth up-and-down shape behind almost everything that follows.
Interactive lab
Sample a heartbeat yourself
Pick how many readings to take each second and see what the computer keeps, and what it loses.
Sign in to open the lab
It is free. Signing in with Google also keeps your progress and your scores.
Sign in with GoogleLesson 1 of every course is open without signing in.
Check yourself
Did it stick?
Work each one out on paper first. Every question has a full worked answer.
- 1
A fitness watch reads its pulse sensor 50 times a second. What is the gap between two samples, in milliseconds?
Worked answer
The gap is the sampling period, one over the sample rate:
A millisecond is a thousandth of a second, so .
- 2
On the same watch (50 Hz), how long after sample 0 does sample 150 arrive?
Worked answer
Count the gaps. From sample 0 to sample 150 there are 150 gaps, and each one lasts of a second:
- 3
A list holds 250 samples. What is the last index?
Worked answer
Counting starts at zero, so the indexes are 0, 1, 2, and so on. The 250th sample therefore has index .
The last index is always one less than the length. There is no in this list.
- 4
A camera takes 60 pictures a second. How many pictures are in a 4-second clip?
Worked answer
Each picture is one sample, so the sample rate is 60 Hz.
- 5
A recording is sampled at 100 Hz, and mV. Which statement is true?
Worked answer
The 7 in is an index: a position in the list, not a time. And 0.3 mV is the value found there.
To get the time, divide the index by the sample rate:
So the value at index 7 is 0.3 mV, taken 70 ms after the start. Because counting starts at zero, index 7 is in fact the eighth sample, which is why the second statement is wrong twice.
Sign in to open the checks
It is free. Signing in with Google also keeps your progress and your scores.
Sign in with GoogleLesson 1 of every course is open without signing in.
Was this lesson clear?
Free weekly email
Get the next lesson by email.
The week's new lessons, the daily facts in one place, one thing to try in the lab and one puzzle. Free.
No spam. One click to leave.